

War, inflation and tumbling markets: the year in 11 charts
Table of Contents
It has been a year dominated by unforeseeable events with stark consequences and few precedents in recent history.
Russia’s full-blown invasion of Ukraine brought the largest land war on Europe since the end of the second world war. Serious inflation has come back to the global economy for the first time in 40 years.
Britain has been coming to terms with the death of a monarch who reigned for 70 years — during a year when it also had three prime ministers, and four chancellors of the exchequer.
And for everyone, there is the perpetual uncertainty and more frequent extremes of the worsening climate emergency.
The FT’s visual and data journalism has brought readers a deeper understanding of the news stories that dominated 2022. The team produces around 10,000 charts, maps and other visual items per year — probably more than any other daily news publication in the world.
Here are 11 examples of our work from this year that illustrate some of the key events of a tumultuous 12 months:

Feb 24
Russia invades Ukraine
The Russian invasion of Ukraine in late February was the most momentous story of the year and gripped FT readers from the outset.
To help readers keep up with developments, we set up a page for our best maps, which were regularly updated. This visual guide to the war was by far the most-read page on FT.com, garnering 3.6mn views.
At first it was used to note the Russian advance, but as Ukrainian defences stiffened and counter-offensives were launched, the nature of the map changed dramatically. Here, we show the portions of the country that have been liberated. Since the start of the invasion, Ukraine has liberated a total of 74,443 sq km of territory from Russian forces, according to data from the Institute for the Study of War think-tank.

Mar 8
Europe aims for gas independence
The EU set a year-end deadline to cut two-thirds of its gas imports from Russia in the wake of the Ukraine invasion. The FT’s visual storytelling team examined the challenges in meeting that goal.
This particular graphic shows how in the Netherlands, 85 per cent of all energy for home heating comes from gas, according to data from the Odyssee-Mure research project. Yet in Finland and Sweden, where households rely on a combination of district heating — industrial-scale boilers that distribute heat to homes — electric heating and wood-burning stoves, gas provides less than 1 per cent of their heating.
The EU plan required that hundreds of millions of households across the bloc collectively turn down their thermostat by 1C. But doing so would only make a real difference in homes that use gas heating in the first place.

June
Inflation hits 40-year high
The economics story was the return of high inflation. This was not part of the prior experience of most commentators, analysts or market participants, since inflation as a serious problem was squeezed out — in the US at least — by the policies of Paul Volcker at the Federal Reserve during the early 1980s.
In the US, inflation rose to 9.1 per cent in June, the highest since 1981, before falling back to 7.1 per cent. In the UK, CPI inflation actually broke double digits, a benchmark not seen since 1982, using the previous RPI measure. Central banks raised interest rates in response, and the rises may well continue into next year.

Sep 8
Death of the Queen
The death of Queen Elizabeth II on September 8 brought to an end the longest reign in British history — over 70 years. Keith Fray’s analysis of the changes in society, economics and politics over her reign contained a chart of the prime ministers by length of service.
Liz Truss’s two days are shown by surely the smallest bar in any published bar chart. Truss was born in 1975, 10 years after the death of Winston Churchill, the Queen’s first prime minister.
Sep 23
Disastrous ‘mini’ Budget
Truss and chancellor Kwasi Kwarteng’s aggressive tax-cutting policies were trailed as long ago as 2012 in the book Britannia Unchained. The abrupt shift in policy should not have been unexpected, but the financial markets took fright.
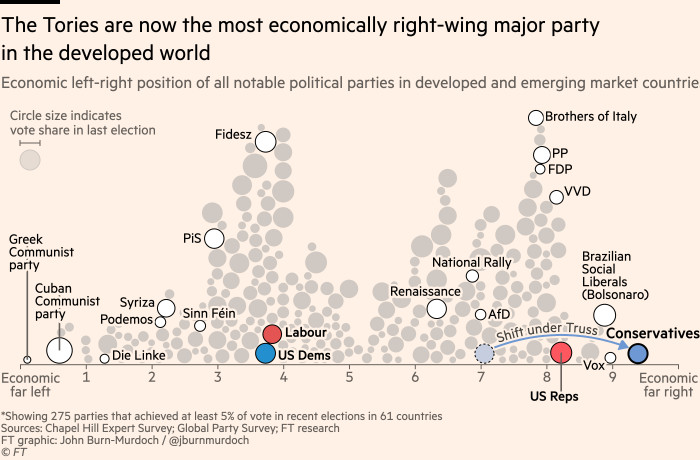
The shift reflected a move rightward politically. Until the “mini” Budget, the Conservative party looked like a relatively normal centre-right party on economics, scoring a 7 on the scale from 0 (far left) to 10 (far right). But in an opinion column in September, the FT’s chief data reporter John Burn-Murdoch visualised how far the new government had moved to the right on economic policy.
The Tories’ score put them well beyond where the Republicans stood under Donald Trump, and just to the right of the Brazilian Social Liberal party that took Jair Bolsonaro to power in 2018. Out of 275 parties in 61 countries, the Tories under Trussonomics ranked as the most rightwing of all.

Oct 17
Trussonomics abandoned
Truss’s premiership in the UK lasted only 49 days, the shortest on record. The reaction of the markets to Kwarteng’s tax-cutting “mini” Budget on September 23 brought sterling to a new low against the dollar and put some pension funds in jeopardy after gilt yields rose precipitously.
Alan Smith’s graphic — a “waterfall” chart — showed the hole in the public finances that new chancellor Jeremy Hunt would have to close.

August
Devastating floods in Pakistan
Once again, extreme weather events affected millions of people around the globe in 2022. Severe heatwaves and drought across the northern hemisphere through the summer saw temperature records broken across the UK and rivers to run dry in Europe. In Pakistan, however, devastating monsoonal rains and glacial melt flooded large areas of the country, damaging more than 2.2mn homes with 1.1mn livestock lost.
To illustrate just how much rain had fallen it was important to compare the data with a normal season — these comparisons are commonly referred to as anomalies. Coupled with a bar chart for some of the most populated districts, this was the best way to highlight the areas that had suffered the largest deviation from normal levels. As can be seen from the map, some areas had 1.6 metres of rainfall more than a typical season, with the areas to the south and east most badly affected.
Climate change was estimated to have made the rainfall up to 50 per cent more intense, according to a rapid study of the disaster in Pakistan by 26 scientists from nine countries, as part of the World Weather Attribution group.

Nov 8
Elections in the US
US voters went to the polls in November for midterm elections, where Republicans were widely expected to win control of Congress. Yet President Joe Biden’s Democrats largely held off the expected “red wave” of Republican gains, retaining control of the Senate.
Sam Learner’s chart showed congressional seats on an urban/rural measure, pointing to strong structural differences between the voter bases of the two main parties.

end-November
Painful year for investors
It was a terrible year for both US stocks and bonds. The Fed signalled last year that rising inflation needed higher interest rates and an end to bond buying support of markets. The S&P 500 index is down 20 per cent from the start of the year; long-term bonds have had their worst year since the 18th century; and the long-established 60/40 investment strategy was hit with its worst year since the 1930s.
A scatterplot of returns shows 2022 as an extreme outlier.
On the lighter side . . .

We covered the various data stories around football’s World Cup in December, but perhaps the most engaging graphic on sports was Alan Smith’s look at the transformation of the England cricket team under new captain Ben Stokes and coach Brendon McCullum. Here, a bold approach paid off in a way that it didn’t for Truss and Kwarteng.
When this chart was published in July the team had won three successive matches after winning one of the previous 17. It has now won nine of the past 10.

From “Special Operation” to The Queue, FT reporters — and their sources — landed repeatedly on some newly popular words and phrases.
While key moments of the year can be easy to recall, timelines are harder to remember. Taking stock of the frequency of the chosen words within FT articles throughout the year, we have a holistic review of the news agenda and cultural trends of 2022.
“Inflation” has become part of our daily vocabulary to the extent that the data in the chart had to be scaled for the frequency of the remaining words to be visible. Each row height represents the peak publication for each term showcasing patterns throughout the year.
Returning to normality post-lockdown has made many consider “quiet quitting”, while the chant “Women, Life, Freedom” has become an anthem for a generation hoping for a brighter tomorrow.